When it comes to trading in the financial markets, there are many tools and techniques that traders can use to help them make informed decisions. The most relevant among them are chart patterns. Chart patterns provide traders with a visual representation of market movements, allowing them to identify key levels of support and resistance and make informed trading decisions. We’ll examine chart patterns in more detail in this post and discuss why doing so can make or break your trading strategy.
At their core, chart patterns are a visual representation of supply and demand in a particular financial instrument. They show us how buyers and sellers interact with each other over time and help us to identify the key price levels at which supply and demand are likely to meet. Traders analyze the price movements of financial instruments over time. They identify repeating patterns that can indicate potential changes in price. By using these patterns, traders make informed decisions about when to buy and sell financial instruments.
Importance of Chart Patterns
Why are chart patterns so important for traders?
The answer lies in the fact that they provide valuable insight into the psychology of market participants. By analyzing chart patterns, traders can identify key levels of support and resistance, as well as potential areas of price consolidation or trend reversal.
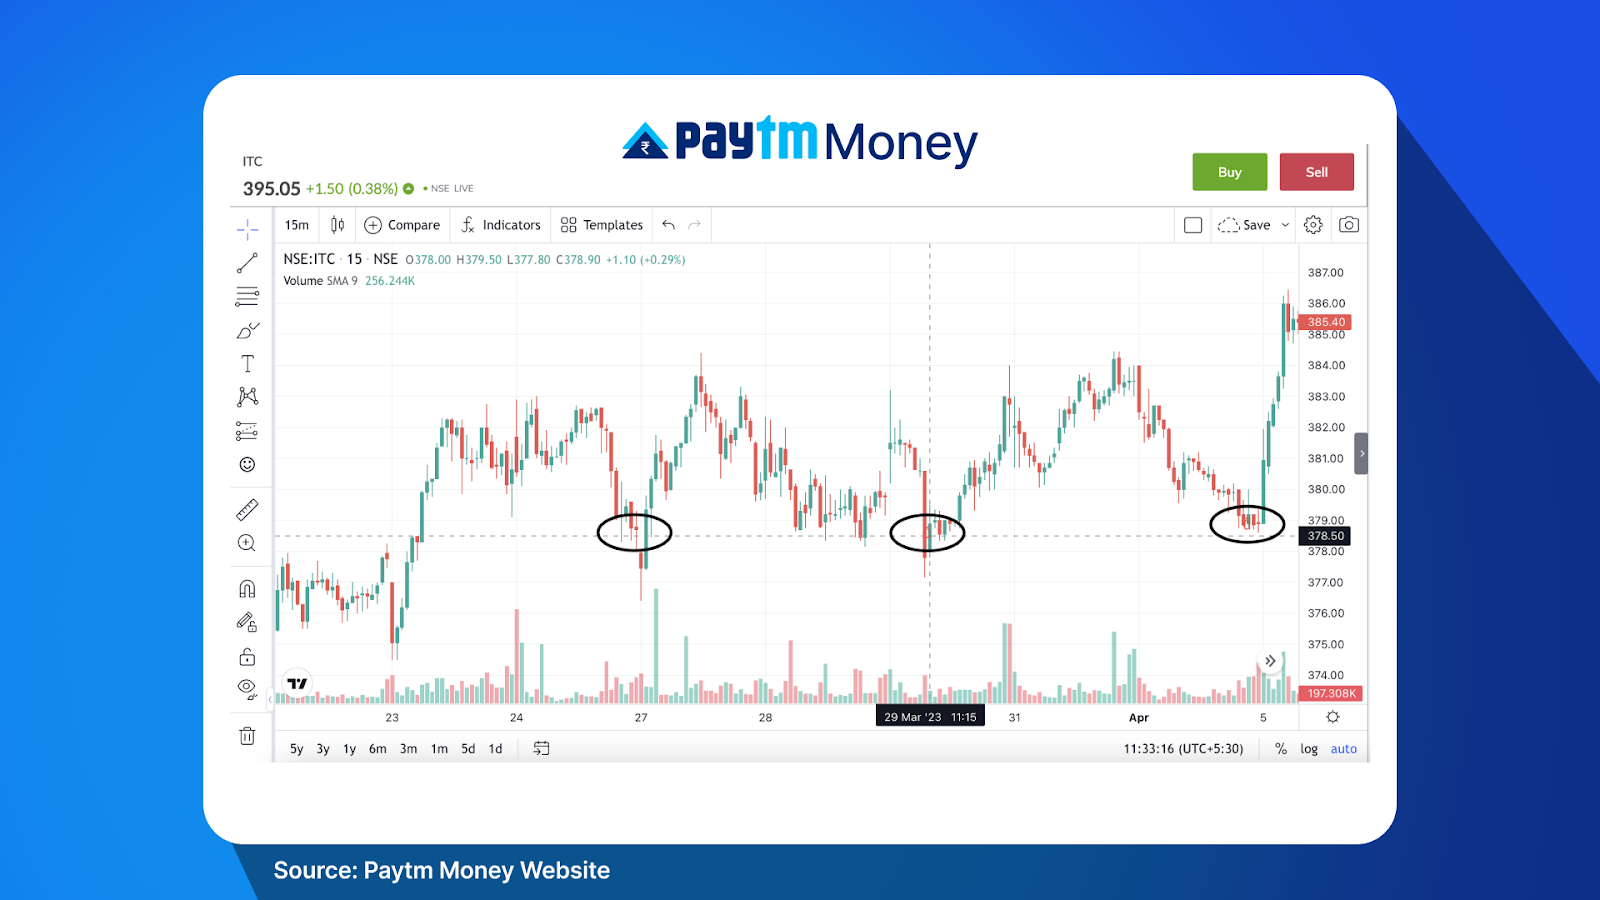
A support level is a price level at which a security, such as a stock or currency pair, tends to find buying interest and experiences enough demand to prevent further price decline. The support level often acts as a trigger for buying the security and absorbs maximum demand.
For example: If you look at the chart below, you would see the price of ITC reaching support levels of 378.50 and then taking a quick reversal to a higher price level
On the other hand, a resistance level is a price level at which security tends to encounter selling interest and experiences enough supply to prevent further price increases. In other words, it’s a price level where there are sellers willing to sell the security, creating a ceiling for its price.
For example: Looking at the same stock of ITC, you can see resistance levels of 382.80 creating a selling interest and leading to a drop in the price level.
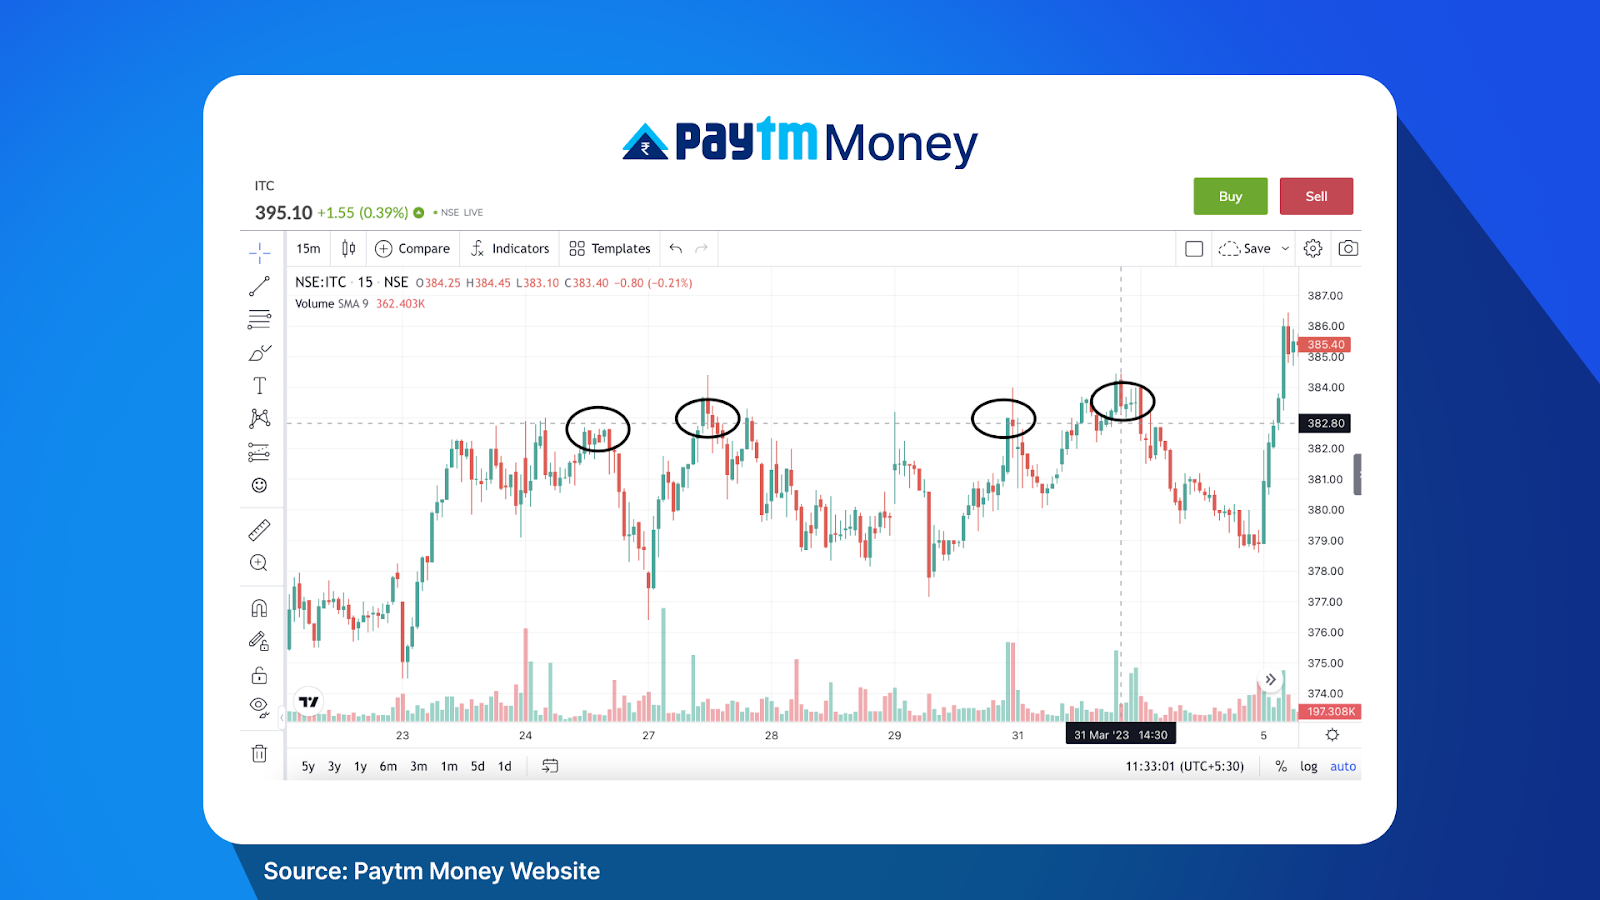
These support and resistance levels would have provided traders with considerable buying and selling opportunities on ITC during this time. This is how understanding simple concepts and observing them while trading can immensely help you improve your chances of profitability in the financial market.
Types of chart patterns
There are two main types of chart patterns: continuation patterns and reversal patterns. Continuation patterns occur when a financial instrument’s price trend pauses briefly before continuing in the same direction. Reversal patterns, on the other hand, occur when a price trend is about to change direction.
Continuation patterns include patterns such as flags, pennants, and triangles. These patterns indicate that the trend in the financial instrument is likely to continue in the same direction after a brief pause. For example, a bullish flag pattern indicates a brief consolidation after a strong price increase before the trend continues in the same direction.
Reversal patterns include patterns such as head and shoulders, double tops and bottoms, and the morning star and evening star. These patterns indicate that the trend in the financial instrument is likely to reverse direction. For example, a double-top pattern indicates that a financial instrument has reached a price level twice and failed to break through, indicating a potential trend reversal.
Identifying Chart Patterns
Identifying chart patterns requires a combination of education, practice, and experience. Here are a few key tips for identifying chart patterns:
- Use multiple timeframes – chart patterns can be easier to identify on longer timeframes, but it’s important to use multiple timeframes to confirm the pattern.
- Look for key levels of support and resistance – chart patterns are often formed around key levels of support and resistance, so it’s essential to identify these levels.
- Use volume indicators – volume can provide additional confirmation of a chart pattern, as increased volume can indicate that a trend is likely to continue.
- Confirm the pattern – it’s important to confirm the pattern with other forms of analysis, such as technical indicators or fundamental analysis.
However, it’s important to remember that chart patterns are not foolproof, and traders need to be aware of their limitations. For example, chart patterns can be subjective, and different traders may interpret them differently. Additionally, chart patterns are based on historical data and may not always accurately predict future price movements.
To overcome these limitations, traders must use a combination of chart patterns and other technical analysis tools, such as trendlines, moving averages, and oscillators. By combining these tools, they can get a more complete picture of the current state of the market and make more informed trading decisions.
We will talk in detail about popular chart patterns and how they can help identify gain opportunities in the articles to follow. In the meantime, look out for patterns the next time you place a trade.
Disclaimer: Investments in the securities market are subject to market risks, read all the related documents carefully before investing. The securities are quoted as an example and not as a recommendation. This content is purely for information purpose only and in no way to be considered as an advice or recommendation. Paytm Money Ltd SEBI Reg No. Broking – INZ000240532. NSE (90165), BSE(6707) Regd Office: 136, 1st Floor, Devika Tower, Nehru Place, Delhi – 110019. For complete Terms & Conditions and Disclaimers visit: https://www.paytmmoney.com/stocks/policies/terms