Option Chain is a listing of all available option contracts for a given security or underlying, along with their specific features. The list displays all available call and put options for a given underlying, along with their prices (Last Traded Price), expiry dates, strike prices, open interest, and advanced features such as implied volatility and Greeks (such as Delta, Gamma, Theta, Vega).
The Option Chain highlights the ATM (At-the-Money) Option, which is the Call/Put option with the strike closest to the current Spot Price. This is because most options trading activity occurs around the ATM strike price. For instance, if Nifty 50 is trading at 17,845, the Option Chain will highlight the strike price closest to this value, which is 17,850.
How Does Option Chain Help Traders?
- Easier access to Option Contracts
Option Chain provides one-click access to a large list of options from which to choose and trade. Without it, traders would have to search for specific script names and repeat the process for each option.
For instance, trading NIFTY 13th April 17800 Call becomes effortless with Option Chain. Just select NIFTY, the correct expiry date, and click the left column near the 17800 strike for the required Option Contract page.
- Trade faster
You don’t have to add option contacts to your Watchlist and compare which options to trade. Because the option chain displays all available option contracts along with relevant information, you can quickly select the right option and trade.
- Access to all expiries
The Option chain provides access to all strike prices for a given underlying (e.g. Nifty 50, Nifty Bank, TCS, etc.).
- Making informed decisions
Option Chain is also jam-packed with market intelligence data such as Option Greeks, Open interest, and so on, which can be used to analyse and make the right decision before trading.
Features of Option Chain
Last Traded Price
LTP tab in the Option Chain shows the pricing information of all the calls and puts inside a single view along with the %change in the price. The price and %change in price changes real time from broadcast (tick by tick data). The price is the first important thing that the Option Trader looks at before placing any Option Trade.
Open Interest
Open interest is a powerful data point which is used by many traders. By analyzing OI carefully, traders can understand where the smart money is being bet. Open Interest can be used to understand the short term Support and Resistance for the underlying (Nifty, BankNifty, etc). The strike with the highest put option Open Interest strike will be the support and Highest CALL OI Strike will be the resistance for the market
Please note – OI is always seen from the Seller’s perspective, because Selling of the option needs more money (Margin Money) and also has unlimited Risk. It is assumed that Sellers have better access to information, so they are risking their capital. It is assumed that Highest PE OI strike has the highest PE sellers and Highest CE OI strike has the Highest CE Sellers.
Let’s understand with the example:
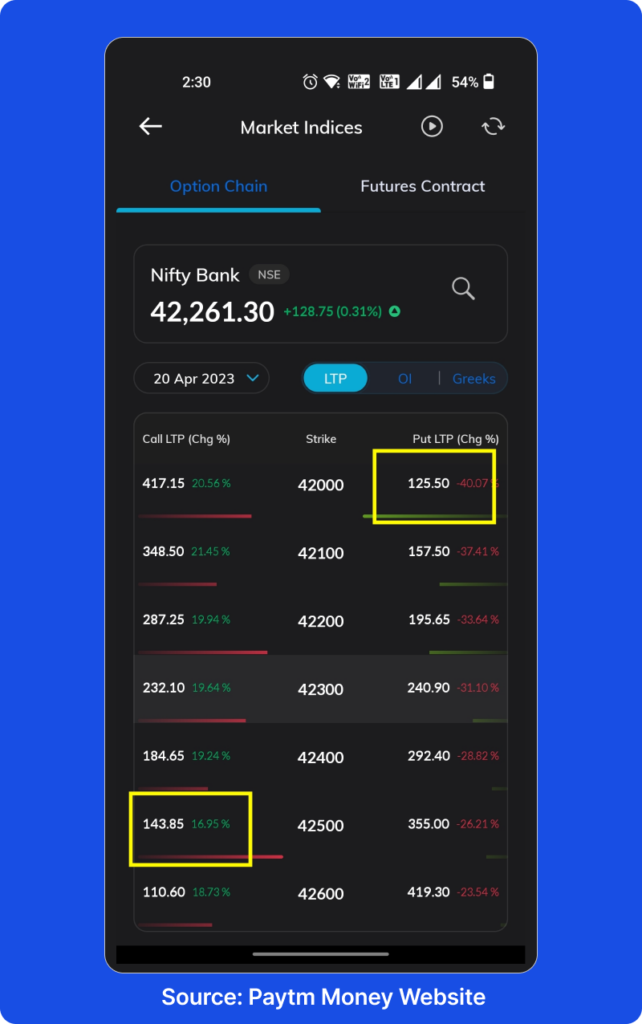
In the above image Nifty Bank is at 42,261.30, 42000 Strike Put has the highest OI among all the PEs and 42500 Strike Call has the highest OI among all the CEs.
It means 42000 PE has the highest number of sellers so market breaking this level is unlikely, so this is the support for that particular expiry for Bank Nifty and 42500 has the highest CE OI, so it will work as a resistance.
Greeks
Option Greeks are a set of calculations which traders use to measure different factors that might affect the price of an options contract. The Greeks measure the Option’s Price sensitivity to different factors like underlying price (Delta), Volatility (Vega), Time to expiry (Theta) and also sensitivity of Delta to underlying Price (Gamma). Advanced Traders use Greeks to hedge their risks.
With the information of Greeks, you can make more informed decisions about which options to trade, and when to trade them.
- Delta, which can help you gauge the likelihood an option will expire in-the-money (ITM), meaning its strike price is below (for calls) or above (for puts) the underlying security’s market price.
- Gamma, which can help you estimate how much the Delta might change if the stock price changes.
- Theta, which can help you measure how much value an option might lose each day as it approaches expiration.
- Vega, which can help you understand how sensitive an option might be to large price swings in the underlying stock.
- Implied Volatility, though not actually a Greek, Implied volatility is a forecast of how volatile an underlying stock is expected to be in the future—but it’s strictly theoretical.
Alerts for Illiquid Contracts
Option Chain also shows alerts for contracts deemed to be illiquid. Illiquid contracts are the contracts which show a higher bid ask spread (high difference between the bid price and ask price of buyers and sellers). In Paytm Money we show the contracts as illiquid if there has been no trade in the particular contract since the last 5 minutes, alerting traders to be careful of such contracts.
Search Feature in the Option Chain
Users can also search any other F&O script using the search icon given in the top right section of the Option Chain to land on to the Option Chain of any other stock or index (Eg. TCS, RELIANCE, FINNIFTY, etc).
How to Place Trades Using Option Chain on Paytm Money?
Step 1: Click on the F&O tab on the homescreen or from the Stocks Dashboard to land on the F&O Dashboard. Alternatively go to the Company Detail Page of any F&O stock or index (eg. Nifty 50 or TCS), or any Futures or Options Contract Page.

Step 2: If you have landed on the F&O Dashboard, tap on the Option Chain Widget for Nifty 50, Nifty Bank, Nifty Financial Services etc. to land on the respective Option Chain Page. If you have landed to the company detail page of any stock or index, or any F&O contracts page, click on the Option Chain widget or icon to land on the Option Chain page.

Step 3: Select the Expiry Date from the drop down, and scroll up or down to reach the strike price you want to trade at. Click on the left side of the strike to trade in the particular call Option and Right side of the strike to trade in the particular put Option.

Step 4: Before taking the trade, users can check the live prices from the LTP Tab, Red and Green Bars for call and put open interest respectively to understand where the maximum Open Contracts are there, click on the OI Tab to check the actual open interest values and compare them across various strikes for calls and puts.

Step 5: For traders who use advanced data points, click on the Greeks tab to check the call and put deltas, IVs (Implied Volatility), Gamma, Theta and Vega at various strikes before making an informed decision.

Step 6: After getting all the information and clicking on the required contract, you will land on the respective contract page, from where you can buy or sell the Option Contract and place the required order.

Voila! Happy Trading.
Disclaimer
Investments in the securities market are subject to market risks, read all the related documents carefully before investing. The securities are quoted as an example and not as a recommendation. This content is purely for information purpose only and in no way to be considered as an advice or recommendation. Paytm Money Ltd SEBI Reg No. Broking – INZ000240532. NSE (90165), BSE(6707) Regd Office: 136, 1st Floor, Devika Tower, Nehru Place, Delhi – 110019. For complete Terms & Conditions and Disclaimers visit: https://www.paytmmoney.com/stocks/policies/terms