Problem Statement –
Paytm is an application that’s been used by millions of people ranging from slow to high-end iOS devices & for different purposes altogether like mobile recharge, wallet transfer, credit card, bank and various other services. But the difficult part is to examine the app user experience because that plays the most crucial role for user retention, and so on the client-side, it’s not so easy to examine it directly though many services provide an understanding of how the users are using the app but we need to go beyond that and have to understand it in flow time perspective manner.
A classic example for the above problem is –
How much time does it take for the user to initiate and complete the payment and which flow he has taken to do the same?
The answer could be 3.5 sec via Paytm QR Scan Flow.
Solution –
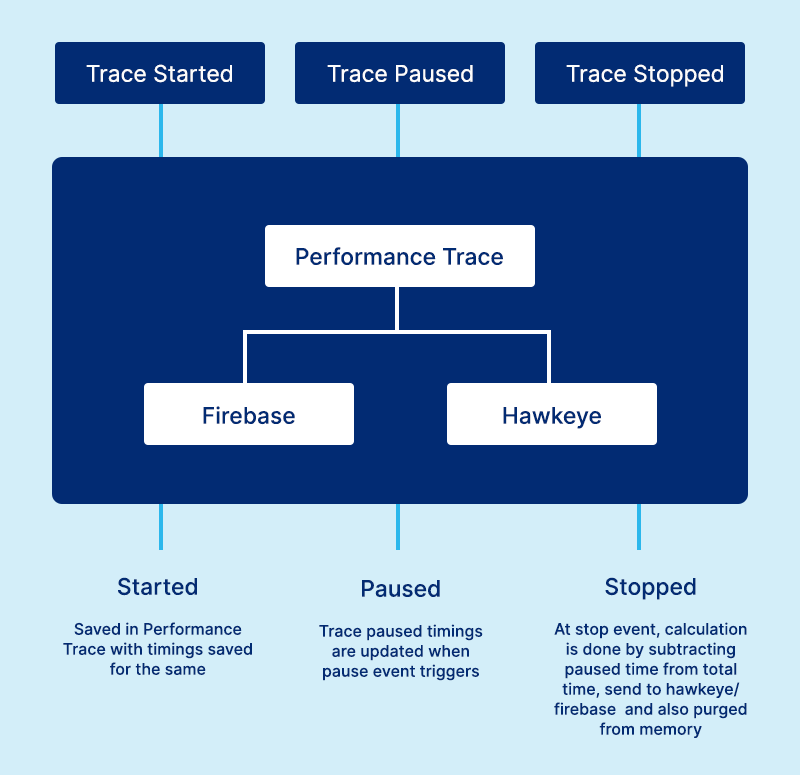
We have been using a different platform that is used to log the info i.e. generated by app ( like firebase and Hawkeye ) but they come with a certain limitation over each other. Talking about Firebase, It allows us to create a log and stop it after a set of interval times when the task is completed but the problem here is – that the total time may also contain remote call completion time and we don’t want to consider the time taken by API ( since they are based on Remote Factor and here we’re focused on App Performance ). Hence there’s no pause functionality to stop it for a particular time interval that we don’t want to consider. This is where hawkeye shines, it leverages us to create custom logs via sending data in the form of JSON and which can be further seen on the hawkeye dashboard, the whole computation of time around the flow can be handled via app logic only.
Enough explanation, let’s go through the implementation –
Architecture wise there are multiple layers to manage the log –
LogManager – which is responsible to provide us with the API for functionality related to pause, play and stop an individual trace. It also tracks on to the parent trace which will be the cumulative sum of all child traces for a particular flow.
The log manager module will be further subdivided into different classes to keep the SOLID principle intact. Those components will be classified as –
Trace – which represents a trace and contains the context and flow information.
| class JRTrace { var context: Any? var screenName: String? var flowId: String? } |
PerformanceTrace – which is responsible for providing the API to process logs and further delegate them to different classes ( for instance we can decide whether the information needs to be processed by hawkeye, firebase or both of them. This is how our performance trace looks like –
| final class JRPerformanceTrace: NSObject { private var firTraces: [AnyHashable : [JRFIRTrace]] = [:] private var hawkeyeTraces: [AnyHashable : [JRHawkeyeTrace]] = [:] private var traceIdHelper: JRTraceIdHandler = JRTraceIdHandler() override init() { super.init() } func log(params: JRTraceParams) { guard level != .none && params.level != .none else { return } switch params.type { default: logFirebase(params: params) logHawkeye(params: params) } } func discard(type: JRTraceType) { discardFirebase(type: type) discardHawkeye(type: type) } func isTraceExist(type: JRTraceType, level: JRTraceLevel = .all) -> Bool { var isExist: Bool = false switch level { case .firebase: isExist = isFirebaseTraceExist(type: type) case .hawkeye: isExist = isHawkeyeTraceExist(type: type) case .all: if type.optInStack() { isExist = isPresentInStack(type: type) } else { isExist = (isFirebaseTraceExist(type: type) && isHawkeyeTraceExist(type: type)) } default: isExist = false } return isExist } func resetTraceSessionId(type: JRTraceType) { guard let name: String = type.parentTraceName() else { return } traceIdHelper.resetId(parent: name) } } |
HawkEyeTrace which is inheriting from Trace class – It will contain the logic on how to process the hawkeye trace based data. The code for this looks like this –
| final class JRHawkeyeTrace: JRTrace { private var pending: Bool = true private var pauseTime: Double = 0.0 private var idleTime: Double = 0.0 private var paused: Bool = false private let handled = “Handled” private let appUpgradeReq = “App-Upgrade” … func stop(stack: [JRHawkeyeTrace]?) { self.calculatePerformanceTrace(stack: stack) self.sendDeeplinkTrace() } func calculatePerformanceTrace(stack: [JRHawkeyeTrace]?) { guard pending else { return } pending = false resume() perfData?.traceName = type.stringValue() perfData?.traceGroupName = type.groupName() perfData?.flowName = flowName if let stack: [JRHawkeyeTrace] = stack, type == type.parentTrace(), type.optInStack() { logStack(stack: stack) } else if type.optInStack() { calculateTraceTime(for: type) } else { calculateTraceTime(for: type) sendToHawkeye(trace: self) } } func logStack(stack: [JRHawkeyeTrace]) { var traceTime: Double = 0 for childTrace in stack { if childTrace.type != type, !childTrace.pending, let childTime: Double = childTrace.perfData?.traceTime { traceTime += childTime sendToHawkeye(trace: childTrace) } } //handle parent trace here if type == type.parentTrace() { perfData?.traceTime = traceTime sendToHawkeye(trace: self) } } func calculateTraceTime(for type: JRTraceType) { let endTime: Double = (CACurrentMediaTime() * 1000.0) – JRAppCommonBridge.shared.launchBootTime perfData?.traceEndTime = endTime if let startTime: Double = perfData?.traceStartTime { var traceTime: Double = endTime – startTime traceTime -= idleTime perfData?.traceTime = traceTime } } func sendDeeplinkTrace() { } func sendToHawkeye(trace: JRHawkeyeTrace) { } func pause() { guard !paused else { return } paused = true pauseTime = CACurrentMediaTime() * 1000.0 } func resume() { guard paused else { return } paused = false let currentTime: Double = CACurrentMediaTime() * 1000.0 idleTime += (currentTime – pauseTime) } } |
FirebaseTrace – It will contain the logic on how to process the firebase trace based data.
| final class JRFIRTrace: JRTrace { private var trace: Trace? init(name: String) { trace = Performance.startTrace(name: name) } func stop() { trace?.stop() } func set(attributes: [String: String]) { //Not putting restriction on key. It is suppose to be 32 chars. Max 5 attributes for firebase for (k, v) in attributes { var value: String = v if v.length >= 100 { value = String(v.suffix(99)) } trace?.setValue(value, forAttribute: k) } } } |
Logs – These are the snippets of code which can be identified as a trace and can be placed at a certain places within the code which we would like to instrument for performance.
Diagrammatic representation of instrumenting a trace –
Considering a case of UPI payment flow, given flow is prepared –
It contain different traces that will be only executed when certain flows will be taken the user, but here we have list all the traces with their definition in place –
upiClick_MTLandingScreenReady – From Send Money To Anyone (UPI) click on the home
upiClick_fetchBeneficiariesRemote – In case of a new/fresh install, there will be no local beneficiaries, in that case we’ll capture this trace as it is required for the user to proceed.
fetch_contacts_local – Time to fetch beneficiaries via API from the point it is called
upiHome_searchContactList – Time to fetch contacts locally from the point it is called till the Contact viewDidAppear is called.
contactSelected_enterAmountScreenRender – From contact click (can be cached recent beneficiaries or local contact from phone till the UI is ready for interaction by user.
enterAmountScreenPayClick_openUpiPin – From pay button click to upi pin dialogs open up.
upiClick_openUpiPin – Parent trace – to capture the entire journey before UPI pin is entered. This will contain the sum of traces from upiClick_MTLandingScreenReady to enterAmountScreenPayClick_openUpiPin.
pinRetreived_postTransactionScreenRender – From *pin retrieved* till the post transaction screen render.
pinRetreived_transactionStatus – Parent trace to capture the entire journey from the time UPI pin is entered till transaction status.
Further Improvements can be made using Stack
So far it seems fine but if you might have not noticed, this solution has some drawbacks like we won’t be able to recognise whether we are sending the same data if we are going back and forth on the same screen. To tackle this problem we can decide to go for a stack based solution. In a flow whenever we start an instrumentation process we keep on stacking the flow time based data inside it but if he pressed the back button then we can pop the last entry and hence remove the redundant logs that might have been sent to hawkeye platform.