Let’s suppose, you are reading an interesting book. You wanted to share the details that you have highlighted in the book.
Taking a photo and sharing it with your friend wouldn’t feel real or helpful. You can’t lend your book to your friend as well.
What if there’s a magical way to duplicate your book without losing your changes and hand it over to your friend?
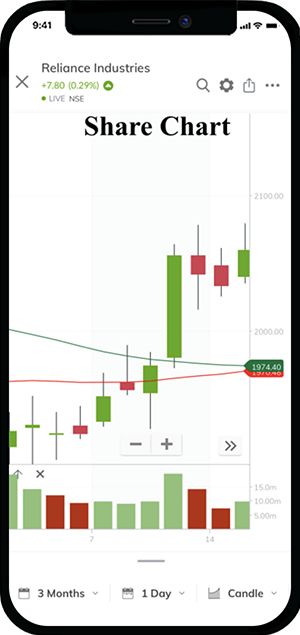
| Just replace the book with your trading chart and re-read the idea- This is “Share Chart” |
We would like to take you through the motivation and process of Share Chart Development.
Motivation – Is there a scope for imagination?
As Developers, we always want to design more than simple if-else-based solutions. Developers are not just people who write code. We do have the imagination and passion to create something useful and benefit millions of users.
But are developers’ imaginations being valued? It is in Paytm Money.

Side Kick Projects – A stage for developers to sketch their imagination into potential features.
It lets you innovate, implement and be responsible for the project end to end.
One such side-kick project is Share Chart.
Paytm Money has given us some dedicated time to do Research and Development. It’s quite competitive and rewarding. This platform has made developers think differently and sketch their ideas, showcase them and get a team on board to bring the ideas to life.
To bring the ideas to life (feature), we needed a team. Though the concept looks simple, the complications and the development process required different platforms to team up.
This is the first-ever side-kick project planned to go live.
Concept of Share Chart
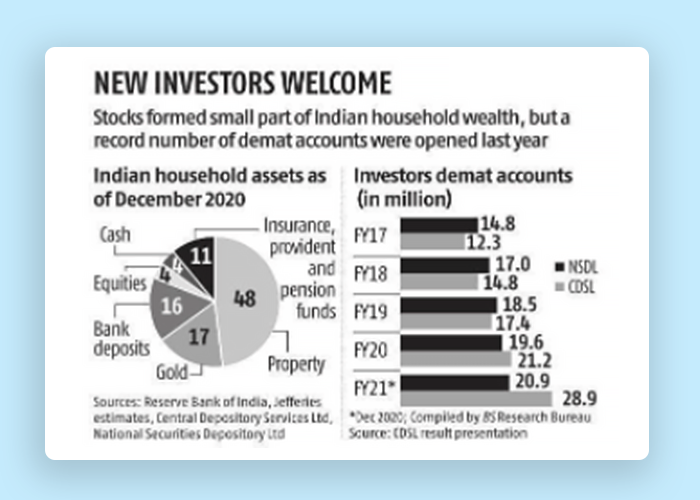
According to the Business-Standard’s statistic (on the right) shows the growth in new investors in the recent five years.
Not every Investor is educated in stock market analysis and could trade on their own with success. Some people require hand-holding at least in the beginning. Like any profession, we do have ample educators available for Stock Market Analysis and Trading.
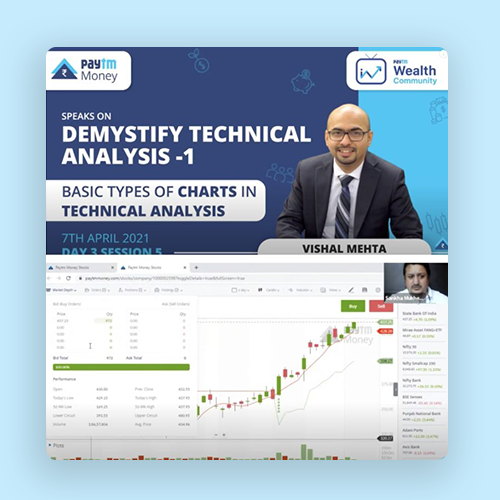
Many professional traders have begun to educate their community via different platforms. Few do it live (Paytm offers Wealth Community) others pre-recorded.
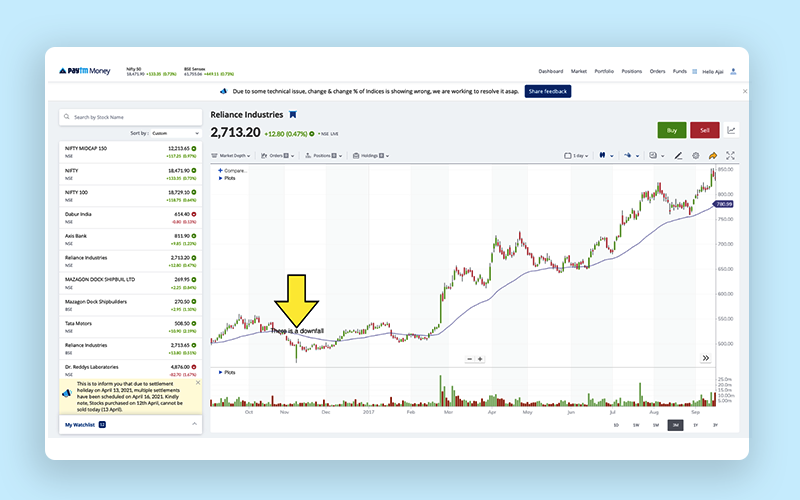
Suppose the tutor has identified a change in the market and wants to mark the indication on the chart screen (Paytm Money Chart offers advanced options for drawings and indicators).
By following a video, a new investor may not understand and could be applying the indications wrongly on the chart other than what was instructed.
We wanted to provide a feature where people can share the complete information on the chart with any other investor. Having such a feature helps educators to share their exact configurations with any of their followers. Thus keeping everyone on the same page.
The concept was clear to us. But where do we begin?
Concept Driven Development
Discussions and brainstorming are mandatory for any workflow. We had multiple brainstorming sessions on how to shape up this feature.
This feature relies more on the core of the Equity-Charts module. Equity-Charts Module uses ChartIQ as the chart interface provider and an API service layer. We decided to go with the below architecture.
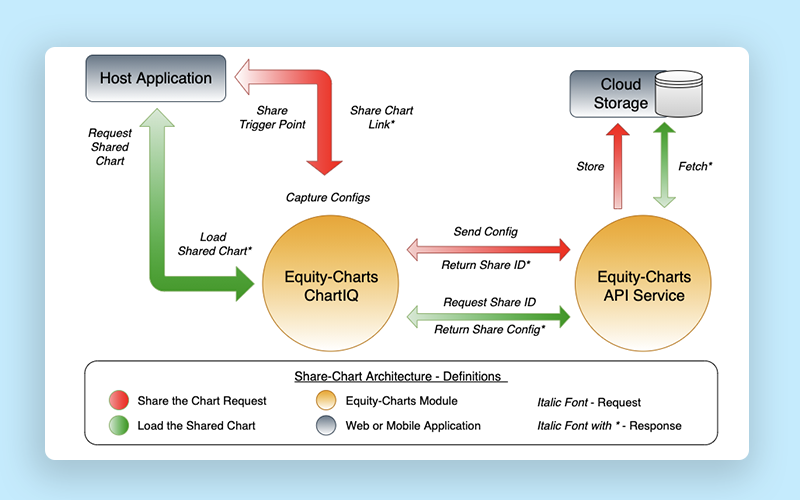
This feature’s flow could be best described as follows.
- Users should be allowed to share the stock’s chart – Trigger Point
- Equity-Charts Module to capture all the configurations and properties on the chart
- API layer to generate a unique ID and validate the configuration
- API layer persists the configs as a JSON object in the cloud (AWS S3)
- API layer returns the Share ID to generate a link for loading the shared chart
- On loading the link, Equity-Charts should fetch the config from the cloud, parse and apply the properties on the host application
Based on the above steps, we were able to achieve the basic functionality, But not a refined one.
Nothing is achieved without effort.
Test-Driven Development and Phase-wise Development were necessary to refine.
Phase-wise Development
Splitting the development phase-wise made it easier to debug issues, test, and refine.
Phase 1 – Storing the Config
On sharing the chart, capturing all the configurations became cumbersome. An elegant JSON configuration was needed.
Debugging the core Chart Library, we figured out the essential information needed for loading a chart.
After storing only the essential information, we ran into a circular object constrain issue (JSON object referring to itself). We then decided to restructure and decouple the references to eliminate this constrain.
Finally, the JSON object was flattened and pushed to storage (AWS S3).
Phase 2 – Delay in Data fetch
When a user wants to scroll back to a past year, Equity-Charts fetches partial data in chunks. So, there might not be any delay in the response.
Suppose the user wants to share a chart while viewing a past year (say 2016 – 2017). The dataset is available from the past year until today (since the user scrolled back from 2021 to 2016).
During the initial load of this shared chart, In a single API request, all datasets were retrieved (from 2016-2021) instead of partial fetches, which impacts the Equity-Charts module’s performance.
We needed to make the loading of data robust. Instead of fetching all data, we wanted to partially load the future data only when the user scrolls to the respective year (2016-2017, 2017-2018, 2018-2019, and so on). By partly fetching, we could programmatically decide on the size of the dataset to be loaded.
After fixating on the size, we were able to optimize the amount of data fetched.
Phase 3 – Cross-Platform Sharing
If a user is sharing a chart from an iPhone or Android device, the screen size is not equivalent to the website screen or vice versa.
Loading only the mobile-viewed chart on the website wouldn’t be a great experience. So we decided to dynamically set the buffer size for data fetch based on the platform.
If extra buffer data is available, we could load the shared charts from a mobile device to the website, ensuring the web app has no blank space on the chart.
Mobile devices load the beginning portion of the chart shared from the web app.
Phase 4 – Stock Specific Configurations
Loading the share chart should always belong to its respective stock. You are not allowed to share a NIFTY 50 chart and load it on Reliance Stock.
On load, the shared chart stock ID gets validated. Only if there is a match, the share-chart will load successfully.
In case of a mismatch, we fall back to the current stock’s chart.
Phase 5 – Integration Testing
Integration testing with all platform is performed and tested.
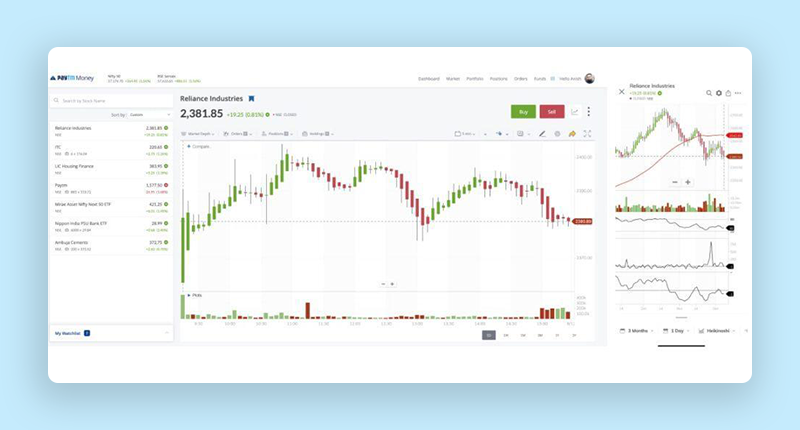
How to Share a Chart on Web
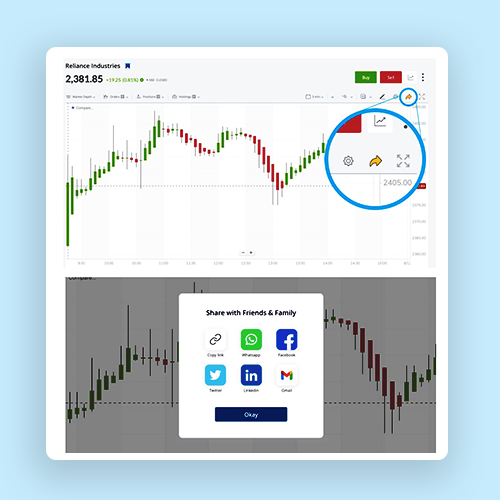
Setup the chart (indicators, chart type, drawings, annotations, etc.), which you want to share.
Paytm Money Web Application has a Share icon to trigger the share chart.
On trigger begins the process of sharing the chart.
After Equity-charts captures the configurations & store the JSON object, we return the shared chart link via a pop-up.
Pop-up provides option to copy the link or directly share it with other listed platforms.
Example Share Chart Link https://www.paytmmoney.com/stocks/index/2000000011?toggleDetails=true&shareChart=BtfSouX_Et8OcFc
How to Share a Chart on Mobile
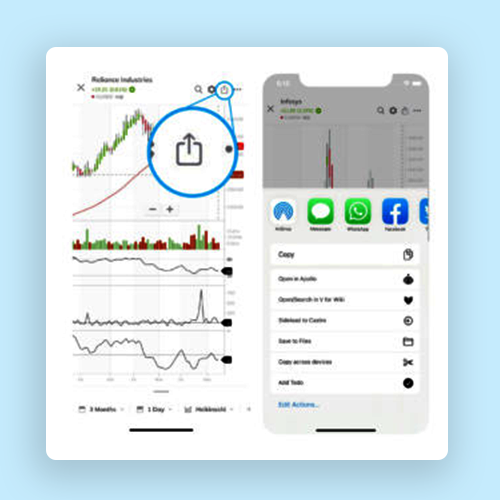
Mobile platforms include iOS and Android devices.
Setup the chart (indicators, chart type, drawings, annotations, etc.), which you want to share. On Mobile devices, we get a Share icon, as shown in the image
Clicking on the icon will bring up sharing options. Users are allowed to copy the link or share it via any other application.
How to Load a Shared Chart
A simple click on the link shared will load your application with the configurations shared (provided you are a valid user of the Paytm Money Platform)
Cross-platform loading of Share Chart
As mentioned earlier on Phase-wise Development – Phase 3, cross-platform sharing has been implemented
To Summarize
In this blog, I have covered the following
- What is a Share Chart?
- Motivation for innovation (SideKick Project)
- The Concept for Share Chart
- Development process
- How do you share a chart
Paytm Money’s team provides many portals for innovation, such as SideKick projects. A simple idea can benefit millions of users. One such simple idea became the Share Chart. Developers are welcome to contribute their ideas and convert them to something useful.
It is already available on all platforms. Who knows, maybe in the future, we might bring in additional features to Share-Chart. Fingers crossed!
Source: Paytmmoney
This blog is a Guest Contribution from Ajai Kumar (frontend Charts).
Disclaimer
Investment in securities market are subject to market risks, read all the related documents carefully before investing. The securities quoted are exemplary and are not recommendatory. Paytm Money Ltd SEBI Reg No. Broking – INZ000240532. NSE (90165), BSE(6707) Regd Office: 136, 1st Floor, Devika Tower, Nehru Place, Delhi – 110019. For complete Terms & Conditions and Disclaimers visit www.paytmmoney.com.